Written by SocialMediaGram Editorial Team · Last updated August 31, 2026 · 16 min read 
You have 10,000 Instagram followers and your latest post receives 120 likes, 8 comments, 14 saves and 11 shares.
Is that good?
The frustrating answer is: it depends on how you calculate it.
Search for the average Instagram engagement rate in 2026 and you can find numbers below 0.5%, around 1%, above 3% and sometimes considerably higher.
That does not necessarily mean somebody is wrong.
They may simply be measuring different things.
For brand accounts, current large-scale studies put typical follower-based Instagram engagement around 0.3%–0.5% per post. A follower-based rate around 1% is therefore strong for many established brand accounts. Smaller creators can often achieve substantially higher rates. Reach-based engagement should be benchmarked separately because dividing interactions by the people who actually saw a post naturally produces a different—and usually higher—percentage.
The most important rule in this entire guide is simple:
Never quote an Instagram engagement rate without saying how it was calculated.
This article explains exactly what Instagram engagement rate means, the formulas you can use, realistic 2026 benchmarks, why follower count matters, and what likes, comments, saves and shares actually tell you about your content.
- What is Instagram engagement rate?
- How to calculate Instagram engagement rate
- Followers vs reach: which formula is better?
- 2026 Instagram engagement benchmarks
- Benchmarks by follower count
- What likes tell you
- What comments tell you
- Why saves matter
- Why shares matter
- How to improve Instagram engagement
- Frequently asked questions
What Is Instagram Engagement Rate?
Instagram engagement rate is the percentage used to describe how actively people interact with your Instagram content relative to a chosen audience or exposure metric.
Those interactions can include:
- Likes
- Comments
- Saves
- Shares
- And, depending on the analytics methodology, other interactions
The denominator is where things become interesting.
You can calculate engagement relative to:
- Followers
- Reach
- Views
- Impressions
That means the phrase “My engagement rate is 2%” is incomplete.
Two percent of what?
Your followers? Accounts reached? Views?
Until you know the denominator, you cannot make a fair comparison.
How to Calculate Instagram Engagement Rate
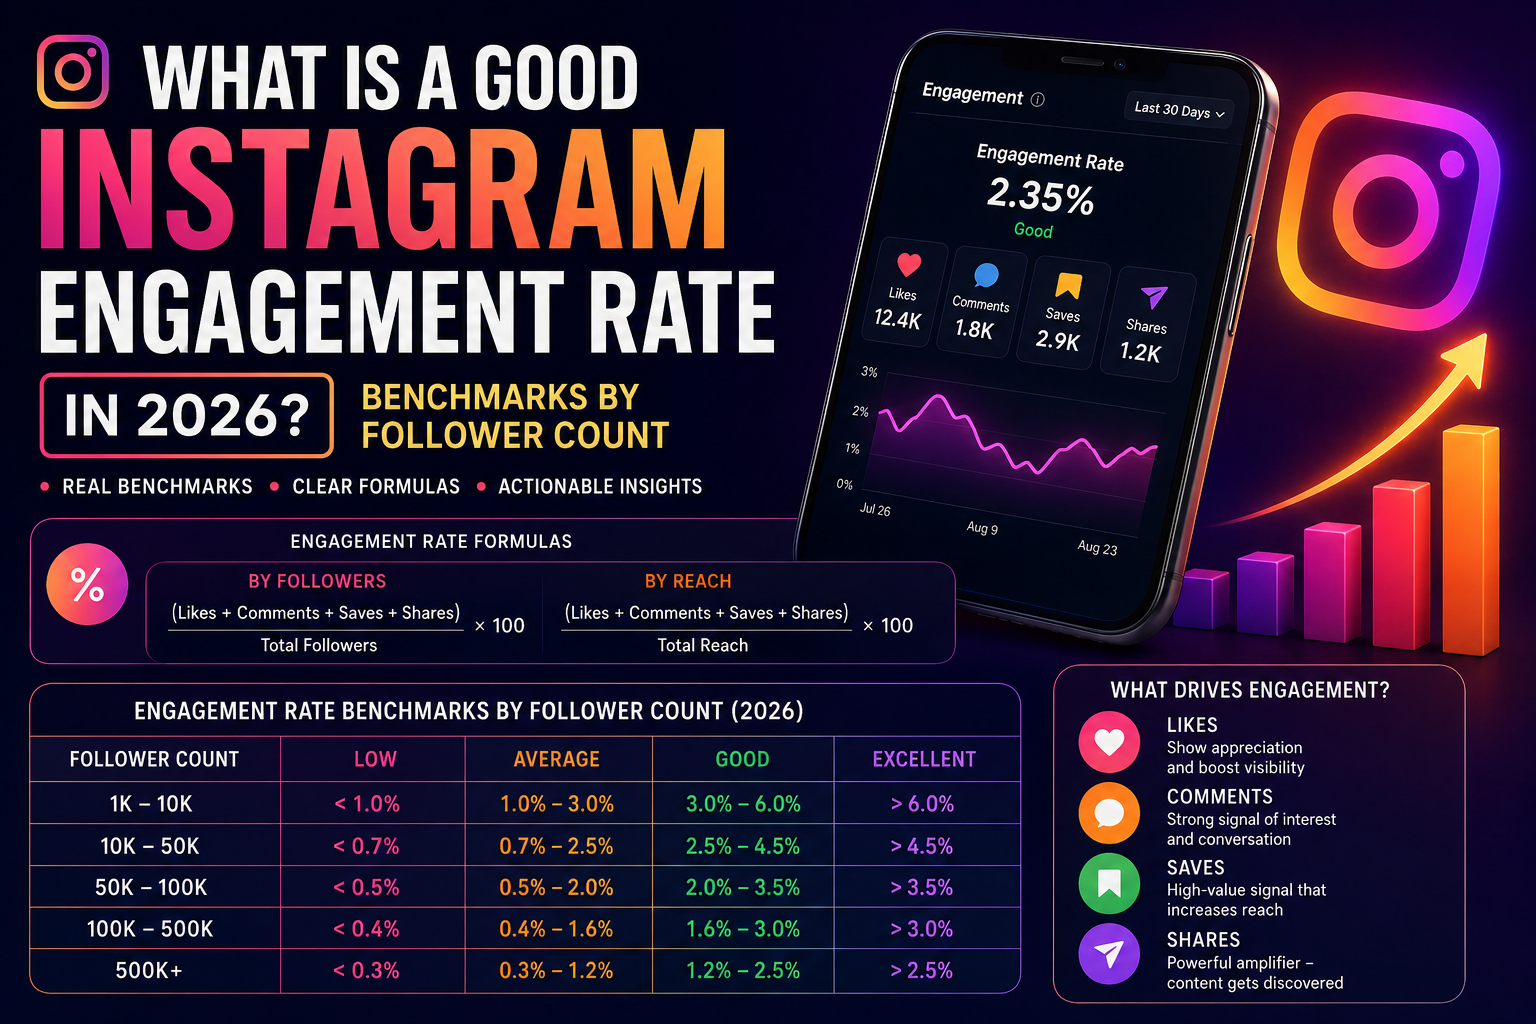
For a useful modern content-level calculation, start by adding the interactions you want to measure:
Then choose the denominator that matches your objective.
Instagram Engagement Rate by Followers
This method answers:
“How much engagement did this post generate relative to the size of my audience?”
It is particularly useful when comparing public accounts because follower count is publicly visible while reach normally is not.
Instagram Engagement Rate by Reach
This answers a different question:
“Of the people who actually received this content, what percentage interacted with it?”
For analysing your own content quality, that can often be the more revealing number.
Instagram Engagement Rate Example
Suppose an account has:
- 20,000 followers
- 5,000 accounts reached
- 180 likes
- 15 comments
- 25 saves
- 30 shares
Total engagements = 250.
Using followers:
Using reach:
Same post.
1.25% engagement by followers.
5% engagement by reach.
Neither calculation is wrong.
They simply answer different questions.
Engagement by Followers vs Engagement by Reach: Which Is Better?
Neither formula is universally “better.” Use the one that matches what you are trying to understand.
| Formula | Best Used For | Main Limitation |
|---|---|---|
| Engagement ÷ Followers | Comparing accounts, influencers, competitors and historical audience performance | Many followers may never have seen the post |
| Engagement ÷ Reach | Measuring how effectively a post engaged people who actually received it | Reach is usually private analytics data |
| Engagement ÷ Views | Evaluating view-based content such as Reels | Views and unique people reached are not necessarily identical |
| Engagement ÷ Impressions | Understanding interaction relative to total exposures | One person can generate multiple impressions |
What Is the Average Instagram Engagement Rate in 2026?
This is where many Instagram benchmark articles become misleading.
Current research does not produce one universal number.
For example, Socialinsider’s 2026 benchmark research analysed approximately 35 million Instagram posts from 447,613 pages. Its methodology calculates follower-based engagement using likes and comments.
Its current Q2 2026 update reports an overall Instagram engagement rate of approximately 0.45%, with:
- Carousels: 0.50%
- Reels: 0.48%
- Images: 0.33%
Socialinsider’s broader benchmark page also reports an overall average around 0.48% across its underlying study period.
Other benchmark datasets land in a similar but not identical range. Rival IQ data cited by Sprout Social puts the cross-industry median at approximately 0.36%.
For established brand accounts, a follower-based engagement rate somewhere around 0.3%–0.5% is not automatically “bad” in 2026. In fact, it is close to large-scale brand benchmarks. A rate around 1% can therefore be very strong depending on account type, niche, size and content format.
Sources: Socialinsider 2026 Instagram Organic Benchmarks; Sprout Social Instagram Engagement Rate Guide.
Instagram Engagement Rate Benchmarks by Follower Count
Follower count matters because engagement rates generally become harder to maintain as audiences become larger and more diverse.
A 3% follower-based engagement rate on an account with 3,000 followers means something very different from 3% on an account with 3 million followers.
There is another important distinction:
Creators and brands should not automatically be benchmarked against each other.
A niche creator with a small, highly invested community can naturally generate much higher engagement than a large retail or corporate account.
For that reason, rather than pretending there is one scientifically universal cutoff for every account, use this practical interpretation framework alongside current large-scale brand benchmarks:
| Follower Count | How to Interpret Engagement | Context |
|---|---|---|
| Under 5K | Expect the greatest potential for above-average percentages | Small communities can have unusually concentrated engagement |
| 5K–10K | Rates above broad brand averages are achievable | Audience relevance matters more than raw follower growth |
| 10K–50K | Around 1% follower-based engagement can already represent strong performance for many brands | Creator accounts may reasonably benchmark higher |
| 50K–100K | Compare carefully against similar accounts and formats | Audience diversity begins to affect headline percentages |
| 100K–1M | Even sub-1% rates can represent substantial engagement volume | Absolute comments, saves and shares become increasingly important |
| 1M+ | Percentage alone becomes particularly easy to misinterpret | Compare reach, interaction quality, conversions and historical trends |
Why Does Instagram Engagement Rate Usually Fall as Follower Count Grows?
Imagine inviting 20 close friends to dinner.
Most will probably talk to you.
Now imagine filling a stadium with 50,000 people.
A much smaller percentage will interact personally with you.
Instagram audiences behave similarly.
As an account grows, it tends to accumulate:
- Highly engaged followers
- Casual followers
- People interested in only one part of the account’s content
- Older followers who rarely use Instagram
- People who simply do not see every post
This is why a declining percentage does not necessarily mean declining influence.
A 0.8% rate on 500,000 followers represents far more interactions than 4% on 5,000 followers.
What Actually Counts as Instagram Engagement?
For practical content analysis in this guide, we use four primary interactions:
Instagram Likes
Likes are Instagram’s easiest visible expression of positive feedback.
A user can like something in a fraction of a second, so a like generally requires less effort than writing a thoughtful comment or sending a post to a friend.
That does not make likes meaningless.
Likes provide fast feedback about whether the content appeals to the audience and remain one of the clearest visible social-proof signals on a post.
If your content is already reaching the right audience but visible engagement looks weaker than you would like, SocialMediaGram’s Instagram Likes service provides an additional social-proof option.
Instagram Comments
Comments require more effort than a simple like.
They can indicate conversation, curiosity, disagreement, enthusiasm or a genuine desire to participate.
But raw comment count is not enough.
Twenty thoughtful comments from relevant people can be considerably more valuable than hundreds of generic one-word responses.
Current Socialinsider data also shows an interesting format pattern: Reels generate the highest average comment counts across the follower tiers in its brand dataset.
For businesses that want additional visible conversation around selected content, SocialMediaGram also offers Instagram engagement services, including comment options.
Instagram Saves
Saves are one of the easiest Instagram metrics to underestimate because other users cannot normally see how many times your post has been saved.
But from a content-strategy perspective, saves can be extremely informative.
A save often means:
“This is useful enough that I want to find it again.”
Recipes get saved.
Checklists get saved.
Workout routines get saved.
Travel recommendations get saved.
Detailed tutorials get saved.
Socialinsider’s current benchmark data shows that carousels generate particularly strong save performance, especially as account size increases.
If saves are part of your promotional strategy, explore SocialMediaGram’s Instagram services for available engagement options.
Are Likes, Comments, Saves and Shares Equally Valuable?
Not really—and trying to assign one permanent universal value to each would be misleading.
They represent different behaviours.
| Interaction | What It Often Indicates | Effort Required |
|---|---|---|
| Like | Quick positive reaction | Low |
| Comment | Conversation or stronger response | Medium–High |
| Save | Future value or usefulness | Medium |
| Share | Content worth passing to another person | Medium–High |
A fashion photograph may naturally earn lots of likes.
A complicated tutorial may generate more saves.
A controversial industry opinion may generate comments.
A hilarious Reel may generate shares.
The “best” engagement depends partly on what the content was designed to accomplish.
Is a 1% Instagram Engagement Rate Good in 2026?
If you mean 1% by followers, then yes—a 1% rate can be very healthy for many established brand accounts in 2026.
Remember that current large-scale brand benchmarks are substantially below the old “3% is average” rule that is still repeated around the web.
Against an approximately 0.3%–0.5% follower-based brand benchmark, 1% is roughly two to three times that broad baseline.
But if you mean 1% by reach, the interpretation changes completely.
Again:
Formula first. Benchmark second.
Is a 3% Instagram Engagement Rate Good?
A genuine 3% follower-based engagement rate is excellent for many established accounts.
For a small niche creator, however, it may be much less unusual.
And a 3% reach-based rate should not be compared with a 3% follower-based rate.
This is exactly why statements such as “3% is a good Instagram engagement rate” are incomplete without context.
Is 5% a Good Instagram Engagement Rate?
A 5% follower-based engagement rate is extremely strong compared with current large-scale brand benchmarks.
But a 5% reach-based engagement rate is mathematically much easier to achieve because the denominator—the people actually reached—is normally smaller than the account’s total follower count.
If somebody tells you they have a 5% Instagram engagement rate, your next question should be:
“Calculated against followers or reach?”
Why Older Instagram Engagement Benchmarks Can Be Misleading
You may still encounter charts saying:
- Below 1% = low
- 1%–3% = average
- 3%–6% = good
- Above 6% = excellent
Those ranges are still useful in some creator contexts, but they should not be presented as universal 2026 Instagram benchmarks.
Large-scale current brand studies show much lower follower-based averages.
Socialinsider reports that overall Instagram engagement has fallen substantially year over year, while static-image engagement has weakened particularly strongly.
The platform has changed.
User behaviour has changed.
Content supply has exploded.
And the way people interact is changing too, with more meaningful activity occurring through saves, shares and private conversations rather than only public likes and comments.
Instagram Engagement Rate by Content Format in 2026
Content format matters almost as much as follower count.
| Instagram Format | Q2 2026 Follower-Based Engagement | Best Strategic Use |
|---|---|---|
| Carousels | 0.50% | Education, saves, storytelling, detailed value |
| Reels | 0.48% | Discovery, entertainment, conversation, reach |
| Images | 0.33% | Strong visual moments, brand storytelling, supporting content |
Source: Socialinsider Q2 2026 Instagram quarterly benchmark update. Its engagement-rate methodology uses follower-based engagement and its broader study methodology defines engagement as likes plus comments.
This means you should not judge every format against exactly the same expectation.
How to Improve Your Instagram Engagement Rate
You do not improve engagement by staring at the percentage.
You improve the behaviours that create the percentage.
- Create stronger first-frame hooks so more people stop scrolling.
- Use carousels for useful information people may want to save.
- Create Reels people naturally want to send to friends.
- Ask questions only when they genuinely encourage conversation.
- Respond to meaningful comments rather than treating posting as one-way broadcasting.
- Create original content instead of simply reproducing competitors.
- Make your niche and target audience obvious.
- Analyse likes, comments, saves and shares separately.
- Compare follower-based engagement with follower-based benchmarks only.
- Track your own 30-, 60- and 90-day trend instead of obsessing over one post.
Good Content Deserves Strong Social Proof
Organic engagement should always begin with content people genuinely want to interact with. But brands, creators and businesses may also want additional visible engagement and social proof around important posts.
SocialMediaGram provides premium Instagram growth and engagement services with straightforward ordering and no Instagram password required.
Should You Try to Maximise Engagement Rate?
Not at all costs.
This is an important distinction for businesses.
Imagine two Instagram accounts.
Account A gets a 4% engagement rate from a tiny audience but generates no enquiries, sales or meaningful profile actions.
Account B gets 1% engagement from a much larger relevant audience and consistently produces website visits, leads and customers.
Which account is performing better?
For a business, probably Account B.
Engagement rate is a diagnostic metric—not the final objective of every Instagram strategy.
What Is a Healthy Like-to-Follower Ratio?
Like-to-follower ratio is a simplified version of engagement rate:
It can be useful for quickly comparing publicly visible posts, but it excludes comments, saves and shares.
For that reason, it should not be confused with a complete engagement-rate calculation.
What Is More Important: Reach or Engagement?
They measure different parts of performance.
Reach tells you how many unique accounts received your content.
Engagement tells you whether people did something after seeing it.
High reach with almost no engagement may mean your content was distributed widely but failed to resonate.
High engagement with very low reach may mean a small audience loves the content but distribution is constrained.
The strongest posts often combine both:
distribution + response.
If reach is the problem rather than engagement, read our guide to why Instagram reach is low in 2026.
How Often Should You Calculate Instagram Engagement Rate?
You can calculate it per post, but strategic decisions should rarely depend on one post.
Track:
- Individual post engagement
- Average engagement over 30 days
- Average engagement over 60 days
- Average engagement over 90 days
- Engagement by format
- Engagement by topic
This helps distinguish a real trend from one unusually viral—or unusually weak—post.
What Is the Best Instagram Engagement Benchmark?
Industry data is useful because it gives you context.
But the most useful benchmark is usually:
Your account today versus your account three months ago.
If your engagement moves from 0.7% to 1.1% while your audience also grows, something is working.
If a competitor averages 2% but you consistently turn your 1% into more customers, the competitor’s prettier percentage may not matter very much.
Use external benchmarks to understand the landscape.
Use your own historical data to make decisions.
There is no single “good Instagram engagement rate” that applies to every account in 2026. Current large-scale brand studies place follower-based averages around 0.3%–0.5%, making approximately 1% strong for many established brands. Smaller creators can reasonably achieve much higher percentages.
Most importantly, always identify the formula. Engagement divided by followers and engagement divided by reach are different metrics and should never be benchmarked as though they were the same.
Frequently Asked Questions
What is a good Instagram engagement rate in 2026?
For established brand accounts, current follower-based benchmarks are roughly 0.3%–0.5% per post, so approximately 1% can represent strong performance. Smaller creators may achieve significantly higher rates. Always check whether the rate is calculated by followers, reach or another denominator.
Is a 1% engagement rate good on Instagram?
A 1% follower-based Instagram engagement rate can be strong for an established brand in 2026 because major brand benchmarks are currently below 1%. A 1% reach-based rate should be interpreted differently because it uses a different denominator.
Is a 3% Instagram engagement rate good?
Yes. A genuine 3% follower-based rate is excellent for many established accounts, although smaller niche creators can naturally produce higher engagement percentages than large brands.
Is a 5% Instagram engagement rate good?
A 5% follower-based rate is extremely strong compared with current large-scale brand benchmarks. A 5% rate calculated against reach is a different metric and should be compared with reach-based benchmarks instead.
How do I calculate Instagram engagement rate?
One useful formula is to add likes, comments, saves and shares, divide the total by your follower count, and multiply by 100. For engagement by reach, divide those interactions by accounts reached instead.
Should Instagram engagement rate be calculated by followers or reach?
Use followers when comparing account-level performance or publicly visible accounts. Use reach when evaluating how effectively content engaged the people who actually received it. Neither formula is universally better, but they should never be mixed within the same benchmark comparison.
Do saves count as Instagram engagement?
They can and often should when analysing your own content. Saves indicate that someone found a post useful enough to revisit. However, some third-party benchmark studies use only likes and comments, so always match your calculation method to the benchmark methodology.
Do shares count as Instagram engagement?
Yes, shares are an important form of engagement when the data is available. They indicate that someone considered the content worth passing to another user. Some external benchmark datasets exclude shares, however, which is why methodology matters.
Why does engagement rate decrease as follower count grows?
Larger audiences usually contain a wider mix of highly active, casual and inactive followers. Because not every follower sees or interacts with every post, maintaining the same engagement percentage generally becomes harder as an audience scales.
Are Instagram likes still important in 2026?
Likes remain useful as a visible indicator of audience response and social proof, but they should be analysed alongside comments, saves, shares, reach, watch behaviour, profile actions and business outcomes.
Final Thoughts
The biggest mistake you can make with Instagram engagement in 2026 is chasing somebody else’s percentage without understanding how they calculated it.
A 0.8% rate can be excellent.
A 3% rate can be ordinary.
A 5% rate can mean something completely different from another account’s 5%.
Context changes everything.
Start with the formula. Compare similar accounts. Separate brands from creators. Compare similar content formats. Track your own trend.
And above all, look beyond the headline number.
The goal is not simply to make an engagement-rate calculator display a larger percentage.
The goal is to create an Instagram audience that notices, responds, remembers and acts.